*Important Note: This blog was originally published in 2017 and has been updated to reflect updated information about speed tests. Insights and opinions have changed over the past three years, but all 2020 updates are noted below each section that warrants an update.
Have you checked your website speed lately? If not, you probably should as your site speed will certainly influence the user experience, and indirectly, your SEO. However, don’t overreact when you see a poor speed score from Google.
*2020 update: Google has now stated that a website’s page load time is a direct ranking factor.
It’s important to understand that Google’s PageSpeed Insights does not actually account for the actual site load time. If you’re using WordPress, you likely are taking advantage of multiple plugins, as we’ll as some custom code. After all, that’s part of the reason why WordPress is so great.
The problem is that Google’s speed test is based on having only one CSS file. With WordPress, you likely have multiple CSS files, unlike a basic HTML or PHP site. An extra CSS file shouldn’t slow your website down. In fact, the website will actually be enhanced with additional features associated with this additional CSS file.
GTmetrix vs. Pingdom…
If you want a better way to evaluate site speed I recommend GTmetrix or Pingdom. Let me give you an example of speed discrepancies between Google and GTmetrix and Pingdom…
*2020 update: it’s important to note that even GTmetrix and Pingdom differ greatly on their speed scores, which we will touch on in more detail below.
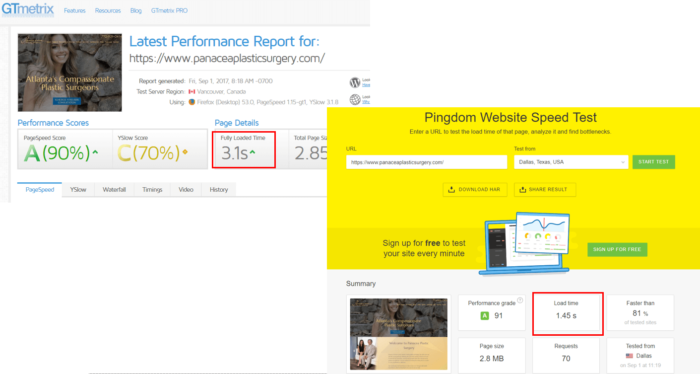
In this comparison test, we’ll use one of our client’s websites. First, let’s start with GTmetrix and Pingdom. As you can see below, both independent tests showed load times of about 3 seconds or less. Both also received “A” grades…
*2020 update: This is an old screenshot from a test run years ago, but the metrics each software tracks are the same now as they were 3 years ago. The point is to highlight discrepancies between the various tests and dig into why they’re different.

*2020 update: the reason for the discrepancy between GTmetrix and Pingdom is the difference between “onload time” and “fully loaded time.” Here’s what each means, as defined by WP-Rocket, a company focused on improving speed for WordPress websites:
On load time: when a web page has finished processing all the resources on the page; all images, text and scripts, have finished downloading. During this time JavaScript may initiate subsequent requests that aren’t fully loaded before the event fires. This leads to inconsistent load times.
Fully loaded time: the time from when the visitor initially navigated to the page until 2 seconds after there’s no network activity. This event fires when a page has completely stopped loading content, including below the fold elements. This means that while your site may have loaded fast above the fold, the performance scan waits for the entire page to stop loading data before it stops, so the page load time might be longer.
Based on these definitions, both on load time and fully loaded time have inherent flaws. However, when it comes to on load time, if you limit your website JavaScript, especially JavaScripts that initiate additional requests, then you have eliminated the key variable in this metric’s inconsistency.
Fully loaded time has no such variable we can account for, and remove, to help with accurate load times. And for TRBO, this definition of needing to wait 2 seconds after there’s no network activity is not an accurate way to evaluate speed as it pertains to a visitor’s user experience.
Evaluating Google’s speed test tools…
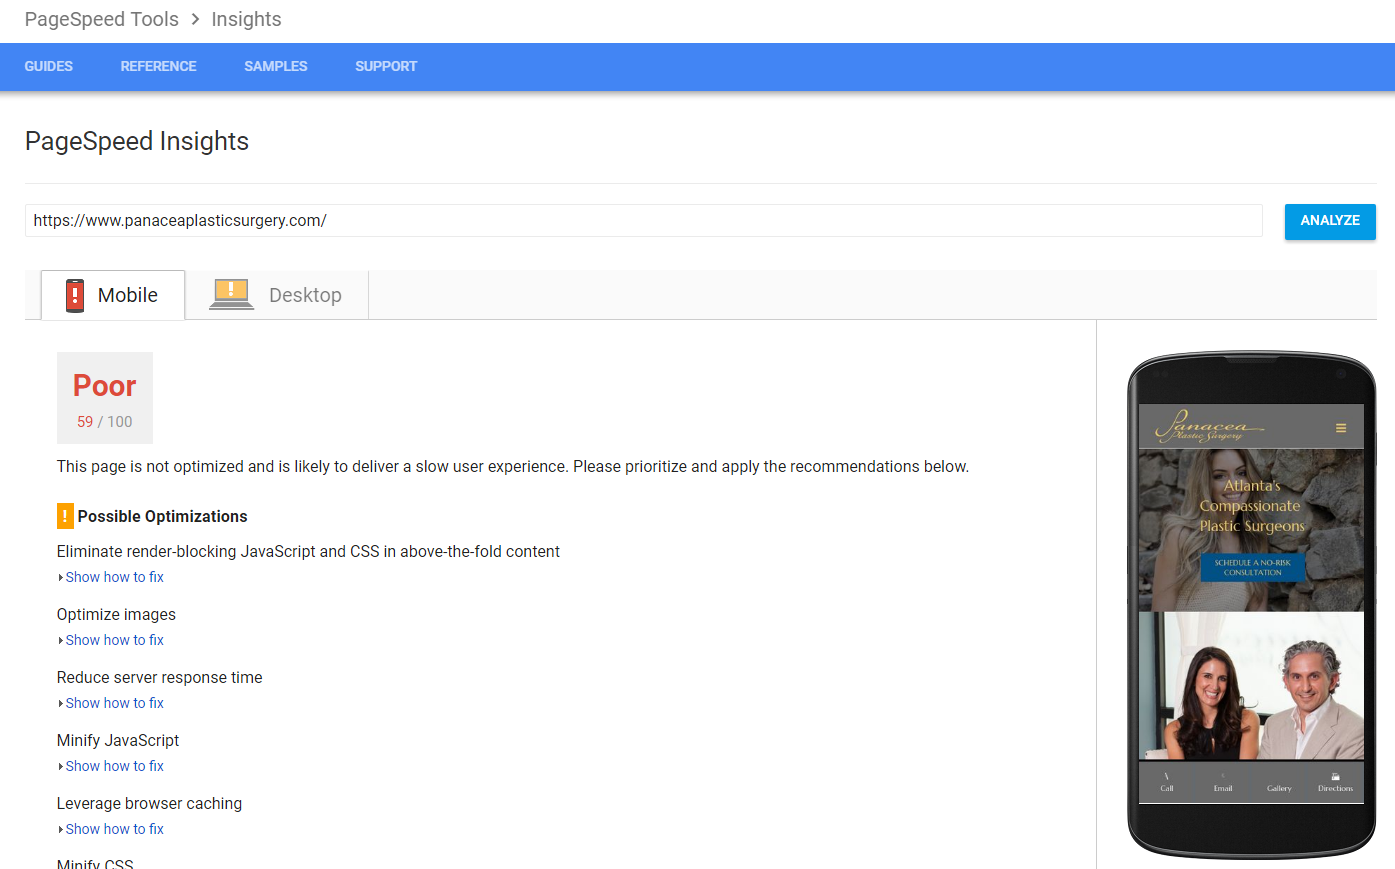
Now, here are the results from the Google’s PageSpeed Insights’ test…

That’s quite a difference. How about Google’s other speed test, their “Think With Google” mobile speed test? Let’s check that performance…


*2020 update: 5G is here (it actually was intorduced in 2019)! Interestingly, on the new Google mobile speed test you can toggle between a 3G and now a 4G connection.
The key thing to know is your actual page load time. If you’re grading out well with GTmetrix and Pingdom you’re fine. Just make sure you’re proactive about keeping your site speed up.
*2020 update: Our position is that if you grade out well on the Pingdom speed score test AND you minimize the use of JavaScript, particularly JavaScript that iniates additional processes, then you can effectively rely on this Pingdom score.
Elementary tips for improving site speed…
The easiest way to stay on top of your site speed is to compress all images. You can use TinyPNG or a WordPress plugin, such as WPSmush. Here are some additional tips, some of which you might need a developer’s help to address:
- Minify CSS, JavaScript, HTML
- Leverage browser caching
- Remove query strings from static resources
These are just a few of the main things to be aware of. If you utilize a solid web hosting company, one that specializes in WordPress website, such as WPEngine, and you have a website or marketing team that stays on top of site speed issues, addressing them as they come, then you have a winning combination.
We love Google for many reasons. Their search engine is the best (in my opinion), and our clients are doing very well with AdWords Google Ads. This is just one instance where I’d be wary of taking their feedback at face value. That said, you might very well have a slow site, we just recommend you confirm that by using the other speed tests tools before you jump to that conclusion.
*2020 update: Our stance hasn’t changed much here. These bulleted list above is a solid start to improving site speed. I would to one key element to this list: do not use home page silders. Also, I would work to limit the number of plugins or additional scripts that need to load on your website, which may necessitate a “spring cleaning-like” project from your developer or webmaster. We still recommend WP Engine as a premium hosting provider and we still respect Google as a search engine and ad platform. It’s just their speed testing tool we have concerns with.
Furthermore, there’s reason to questions GTMetrix as a reliable speed test tool if you are relying on the fully load time as your sole gauge of tracking speed. We’ve stated our concerns with this above.
Lastly, one thing that we didn’t touch on back in 2017 when this article was written is the use of letter grades by many of these speed tracking tools. While there’s validity in some of these grades, getting an “F” grade in other instances isn’t bad at all. In fact, in some cases it’s actually good, which makes the letter grades misleading.
For example, “avoid landing page redirects” is a recommendation. In many cases, redirects are necessary, unavoidable, and crucial to enhance or preserve SEO. There’s also nothing you can do about the existiance of re-directs if you have them, so there’s nothing you can “fix” this grade. This is just one example of why you shouldn’t read too much into what the letter grades are telling you.
Do you have any questions about site speed or want to improve load times?
Talk to TRBO today by dropping us a line here or calling 877-673-7096 x2.


![[R.I.P] eRelevance – What now?](https://advancemedia.com/wp-content/uploads/2019/04/eRelevance-Closed-for-Good.jpg)


