
Google Analytics is full of great information. However, as I’ve pointed out in previous articles, some of the data can be misleading. If you’re running an aesthetic practice focused on growth, then you not only need to know your numbers, you need to know how to dig into the numbers and not always take them at face value.
Bounce rates, average session duration, and average pages/session can be influenced by how a session is tracked. This fact is neither good nor bad; it’s just something to be aware of so you don’t get too hung up on these ancillary metrics.
Within Google Analytics, your website traffic is broken into sessions, users, and new users. Sessions are a period of user activity not interrupted by more than 30 minutes. Sessions will always be higher than Users since a single user can generate multiple sessions.
Sessions, users, and new users almost always move in the same direction, albeit at slightly different pacing, so if you see sessions rising in a given date range, you’ll almost always see users and new users rising as well.
Understanding Fluctuations in Traffic
Can you trust your traffic data to be accurate? What happens when there are small or massive fluctuations?
Generally speaking, you want to continuously grow your traffic to your website. If you can accomplish this while maintaining a strong conversion rate, you will generate more conversions (leads), generating more consultations, more new patients, and more revenue. This funnel, coupled with a sound strategy for re-engaging/reactivating existing patients, is the formula for growth.
Traffic, conversion rate, and conversions are the three most important Google Analytics metrics to track.
If you grow your traffic and your conversion rate drops, leading to the same or fewer leads, either you have an issue with your website from a conversion rate optimization standpoint, or you have spammy or irrelevant traffic visiting your site inflating your traffic numbers…or, quite possibly, both.
In this article, we’ll touch on several ways to evaluate your traffic in greater detail, so you’re not fooled by false-positive or false-negative traffic trends. I’ll stick to “basic Google Analytics” as we have not fully transitioned to the newest Google Analytics (GA4) version yet.
1) Segment by Source: Don’t Just Look at Total Traffic
Step 1 is to never just look at the top-line traffic number. That can easily be influenced by a variety of different things, especially advertising. If you suddenly stop or start running ads, your total Sessions or Users can fall or rise dramatically.
Under Acquisition > All Traffic > Source/Medium: Look at the top sources of traffic under Source/Medium and identify the specific percentage increase or decrease for each source/medium in the date range you’re evaluating.
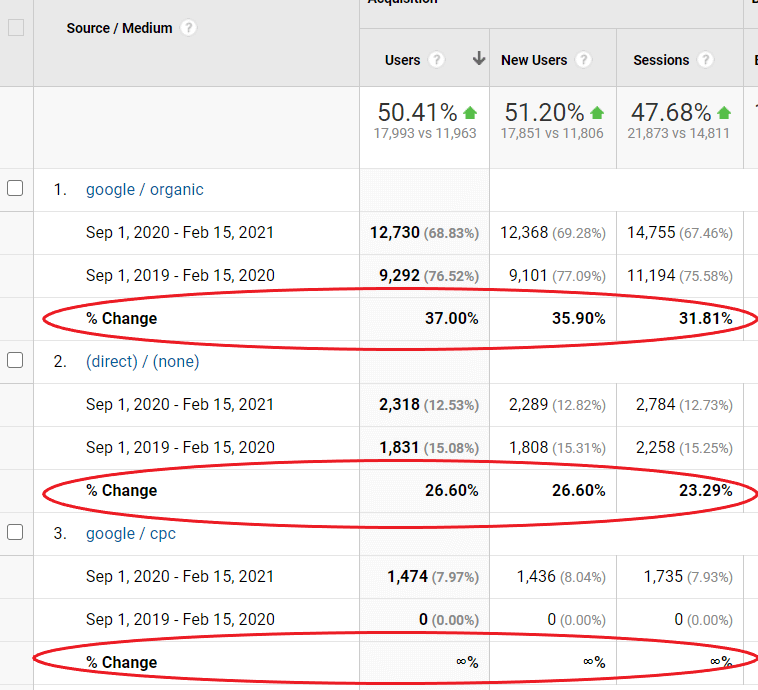
Evaluating all your traffic sources will also allow you to spot spammy sources driving traffic. These are fairly easy to spot and can be removed with a simple filter.
2) Segment by Device Type: Look for Variance
You can stay in the same section from #1 and add a secondary dimension for this task: “Device Category.” This will allow you to further investigate traffic patterns for mobile vs. desktop for each source/medium.
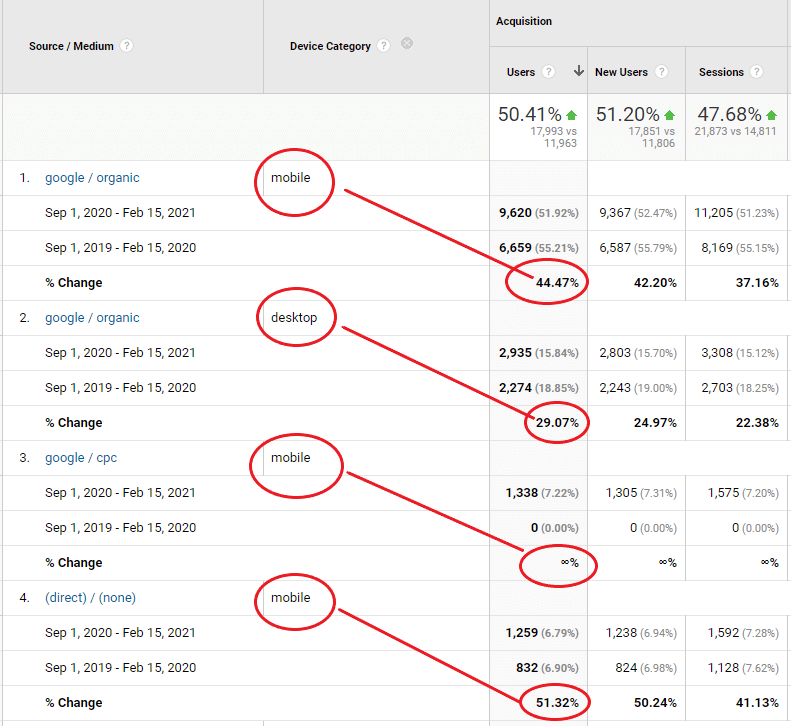
You can also want to navigate to Behavior > Mobile > Overview to see a breakdown of all mobile vs. desktop traffic.
What you’re looking for is variance or deviation for a single source, not just for traffic but also ancillary metrics such as bounce rate. It’s also very valuable to know the percentage of your total traffic segmented by Source/Medium and Device Category, which can see under Behavior > Mobile > Overview.
3) Identify Traffic Inflation: Spam/Bots
Running ads can dramatically increase or decrease total traffic and paid traffic, but what about spikes in organic traffic?
First, it’s important to understand what’s transpired in the date range you’re comparing. If you’re comparing this month vs. last month and see a huge drop-off in organic traffic and you haven’t changed much in your website, your website may have been penalized, leading to a drop in organic rankings. Check Google Search Console immediately to verify if you’ve been penalized under Manual Actions. Then check your ranking reports to spot any movement.
You may also have an issue with your tracking. If this is the case, however, you won’t be able to track any data as long as it’s not working, so it’s worth confirming that in the date range, you’re comparing if there are any days, or multiple days, with zero traffic. That’s a telltale sign of a tracking issue.
It’s not common to see huge jumps in organic traffic unless you’re comparing year-over-year, but even then, context is everything.
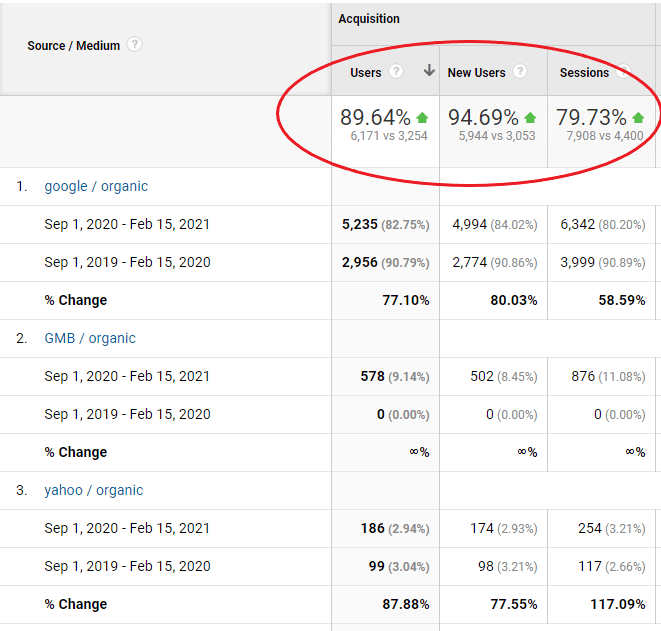
If you had poor SEO last year and focused on content marketing, backlinking, and all the other technical and on-site SEO work to improve your rankings, it’s certainly possible you might see a huge jump in organic traffic, like the example below.
But what if not much has changed in the past year? How could your organic traffic rise or fall so dramatically?
If your rankings haven’t changed much in the past year, a large rise or fall in organic traffic is likely due to one of these two issues:
- Traffic from outside your metro
- Fluctuations in Direct traffic
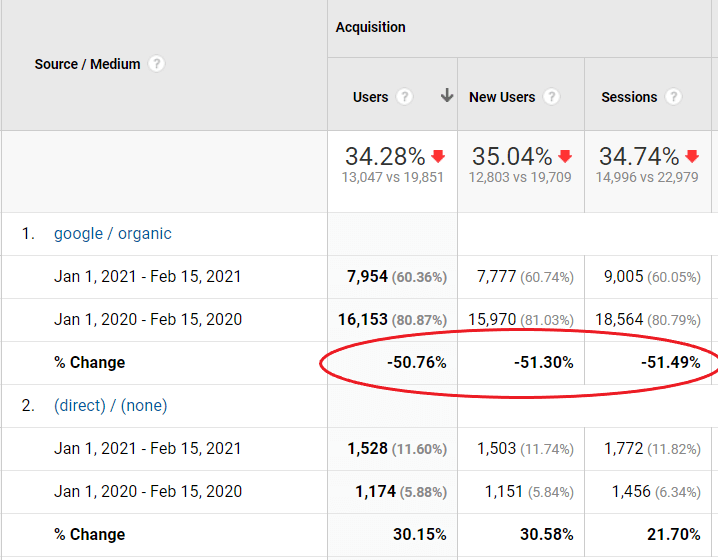
Notice I left spam off. This is because you’re most likely to see spam traffic as a unique referral traffic source and not lumped into organic traffic.
4) Identify Traffic Inflation: Traffic from Outside Your Area
If you see a huge spike or decline in organic traffic, navigate to Behavior > Site Content > Landing Pages for a closer look at the individual pages your website visitors are landing on. Now you’ll want to use the secondary dimension again, this time segmenting by city.
Now, what do you see?
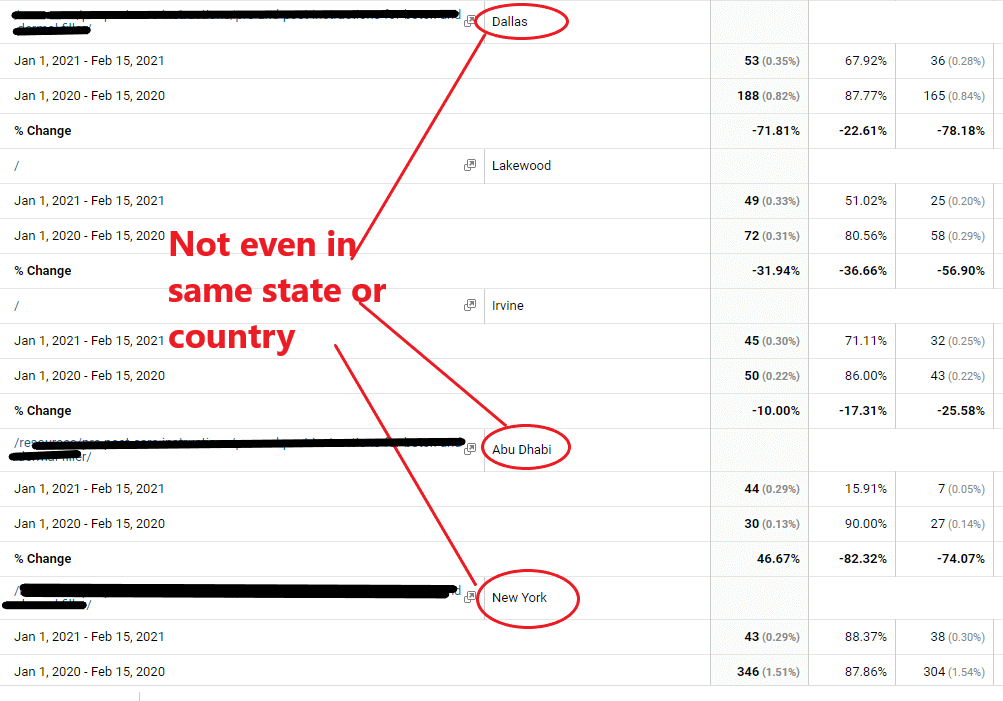
The first question you might have is: isn’t a bunch of new traffic from visitors outside my metro spam? Not necessarily.
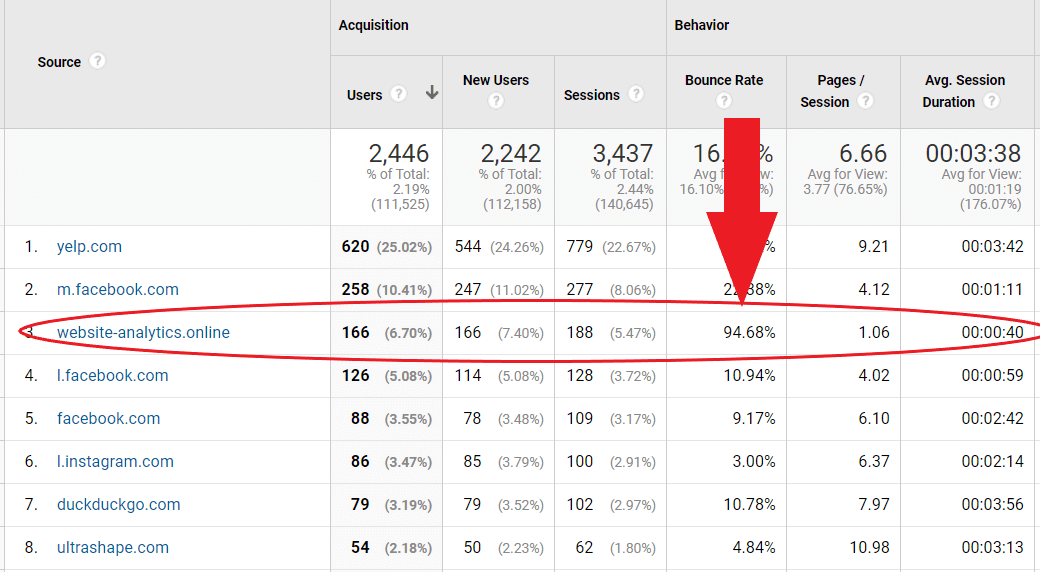
When I say “spam,” I am referring to bot traffic (not a real human). You can pretty easily identify this by the source it came from and by the metrics such as bounce rate (it’ll be very high) and conversions (they’ll be non-existent).
Also, as noted above, you can identify spam traffic most often Acquisition > All Traffic > Referrals. See the screenshot below for an example:
Also, it’s possible your website is ranking for terms in other cities, states, and even countries, driving legitimate visitors to your website! This could lead to huge spikes in organic traffic that ultimately results in inflated or deflated numbers.
How can you confirm this? In Google Chrome:
- Pull up an incognito window in your browser.
- Use the GS Location Changer browser extension to set your location to the outside city that is driving a lot of traffic to your website.
- Then cross-reference what page these visitors are landing on and note the keywords it’s optimized for.
- Now search in your incognito window for these keywords plus the city and see what comes up. If you see your website ranking highly, you have some proof that this is not spam. It is legitimate, albeit not as relevant, traffic generated because your website ranks highly in another metro, state, or country.
It’s not bad to rank highly in other cities, states, and countries, but these people are less likely to become a lead given their distance from you if you’re a local aesthetic practice. However, don’t discount this entirely. Plastic surgeons especially can draw patients from all over the country and world.
Ultimately, if you want to drill down to traffic from visitors in your metro, you can set up a filter for this as well.
5) Evaluate Direct Traffic Trends vs. Organic Traffic Trends
Vistors marked as coming from “Direct” could be accessing the website in various ways. Yes, they could be coming directly to the website, but it could be traffic from:
- an incognito window
- an improper re-direct
- a link from certain social apps
- a link from a non-web document
- a URL shortener
- a mobile app
- an improper re-direct
- and much, much more…
Check out this article that does a deep dive on Direct traffic.
As mentioned above, context is everything. In the date ranges you’re comparing, make a note of what has changed in that time-frame. It’s quite possible that more of your organic visitors from search engines are being flagged as Direct.
If this is the case, then you’ll see organic traffic falling and Direct traffic rising. If you see significant shifts in both, then you’re on to something. If you’ve spotted this trend, I advise you to review the steps from the previous step of investigating landing pages but this time for Direct traffic to see if you can glean any insights.
It’s also possible that you might have organic traffic that is misclassified as another source.
Two examples of organic traffic that is misclassified as direct are:
- Tracking URLs from Google My Business that says something like “google / (none).” A simple filter will fix this.
- Visitors who used an Android search app being classified as “referral.” Again, a simple filter will fix this.
Of course, these are easy to spot. Some likely visitors are browsing your website marked as “direct / none,” and you have no way to identify them, which is why you need to look at organic and direct traffic in tandem.
When to be Concerned and Not Concerned
If both your Organic and Direct traffic are significantly declining AND your website conversions are also declining, then you likely have a big problem.
The goal is to be able to spot trends before you get to this stage. Keep on top of movements in any direction but make sure you know how to segment the data you see so you don’t jump to any conclusions without a deeper dive.
Struggling with Analytics? We Can Help!
Is your aesthetic practice struggling with Google Analytics, or simply stuck coming up with a marketing strategy to drive more traffic and generate more leads? TRBO can help! Trust the experts with your digital marketing. Take the next step and reach out today for a free Conversion Rate Optimization (CRO) analysis. Give us a call at 877-673-7096 x2 or fill out the form here.