
 Google Analytics is an absolutely vital tool in tracking your website’s progress each month. You can use the software to track website traffic, evaluate sources of traffic, user engagement, leads, and much more. But it’s much more than just a solution for tracking.
The data that you interpret from Google Analytics can also be used to spot opportunities to improve your website. By tweaking pages on your website you can improve user engagement – such as bounce rates, average time on site, average pages viewed per visit – as well as boost your conversion rate (the percentage of visitors who convert into leads).
Here’s how you can get started today:
1) Know where to look in Google Analytics
The key is to evaluate pages that are getting a lot of traffic. The pages that are getting no traffic to them either have an SEO problem (which could be an easy fix), or you’re not giving the page enough visibility in your menu or via links, or both.
While your new and future blogs will help to (hopefully) increase traffic, there are already pages on your website generating traffic and these pages are the best places to look for opportunities to generate leads.
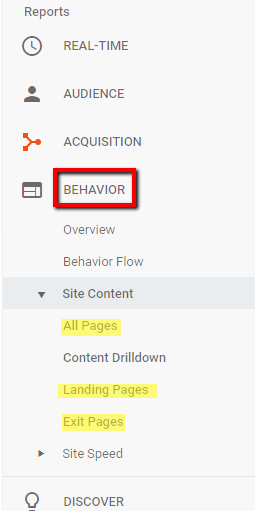
The three best places to spot these opportunities in Analytics are: Landing Pages, All Pages, and Exit Pages. All of these can be found in the Behavior section, under ‘Site Content’.
2) Know how to interpret the data and spot opportunities
Start with Landing Pages. You might not be surprised at all about the top landing pages. If you’re running Google AdWords for a few procedures then those landing pages should show up near the top of the list, along with your home page.
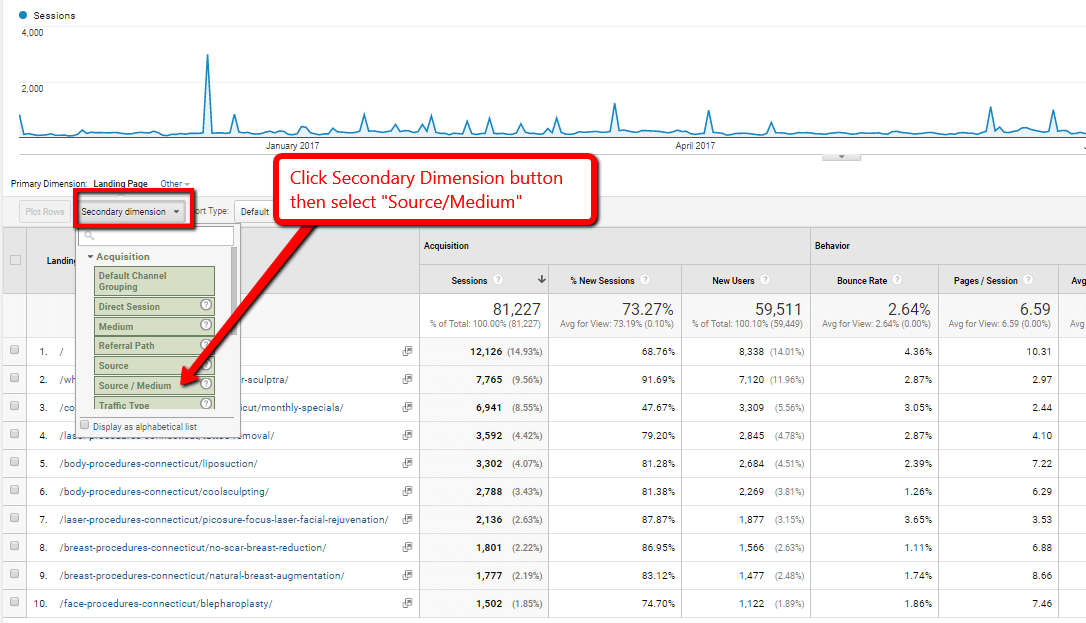
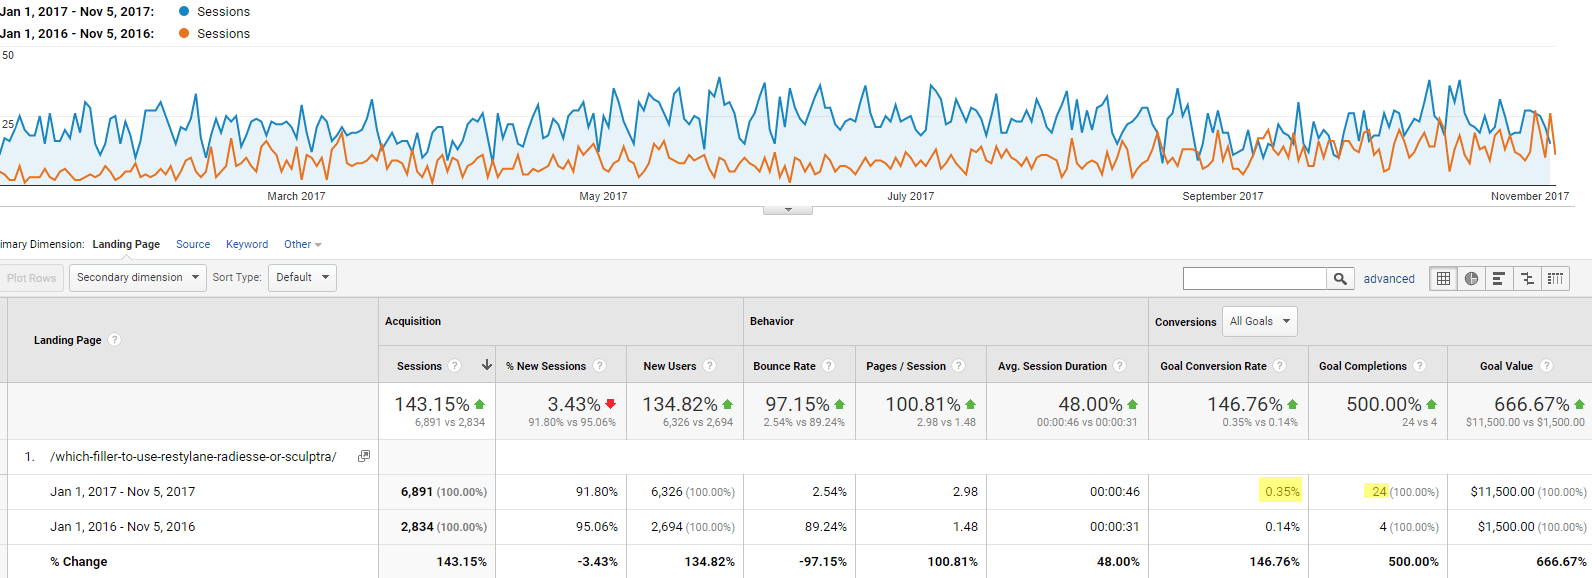
Let’s assume, for the sake of this article, that those pages all look great. Dig a little deeper and you might find some surprises. For additional clarity, you might want to add a secondary dimension that shows the source the traffic came from next to the landing page…
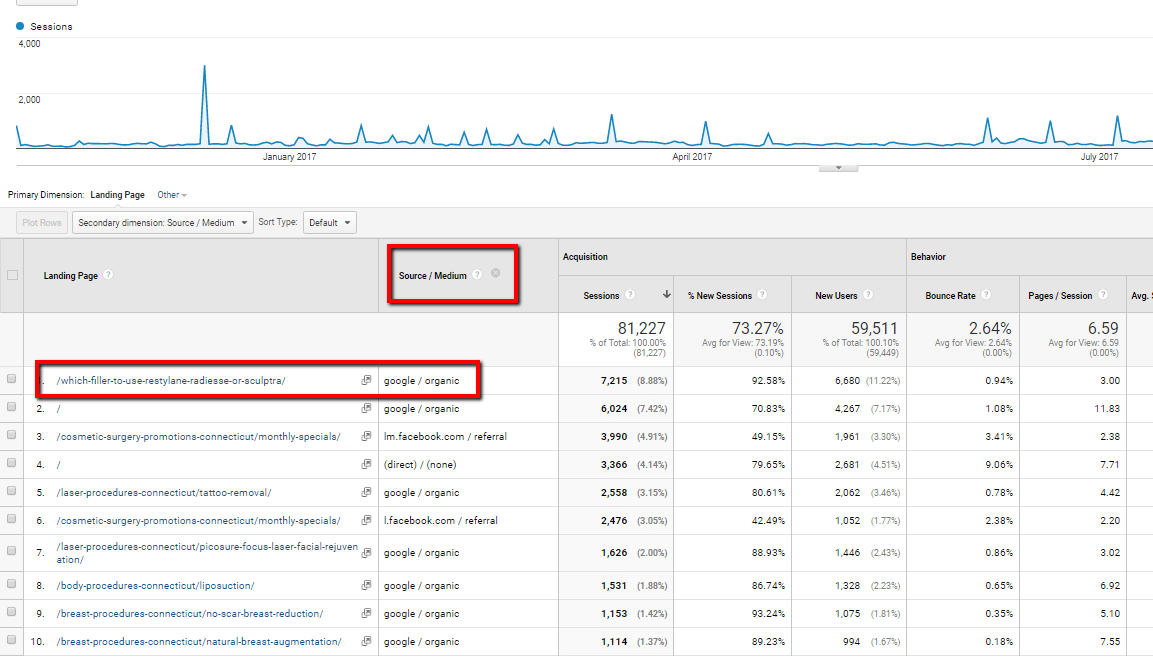
See if you notice any blog articles or procedure pages that you didn’t expect to, such as the above example on the right screenshot. Then open these pages up to evaluate them. Ask yourself:
a) Is the page thorough? Is there substance to the content or could it be “beefed up” at all?
b) Is it easy to read? Are there images or other media helping to break up the text?
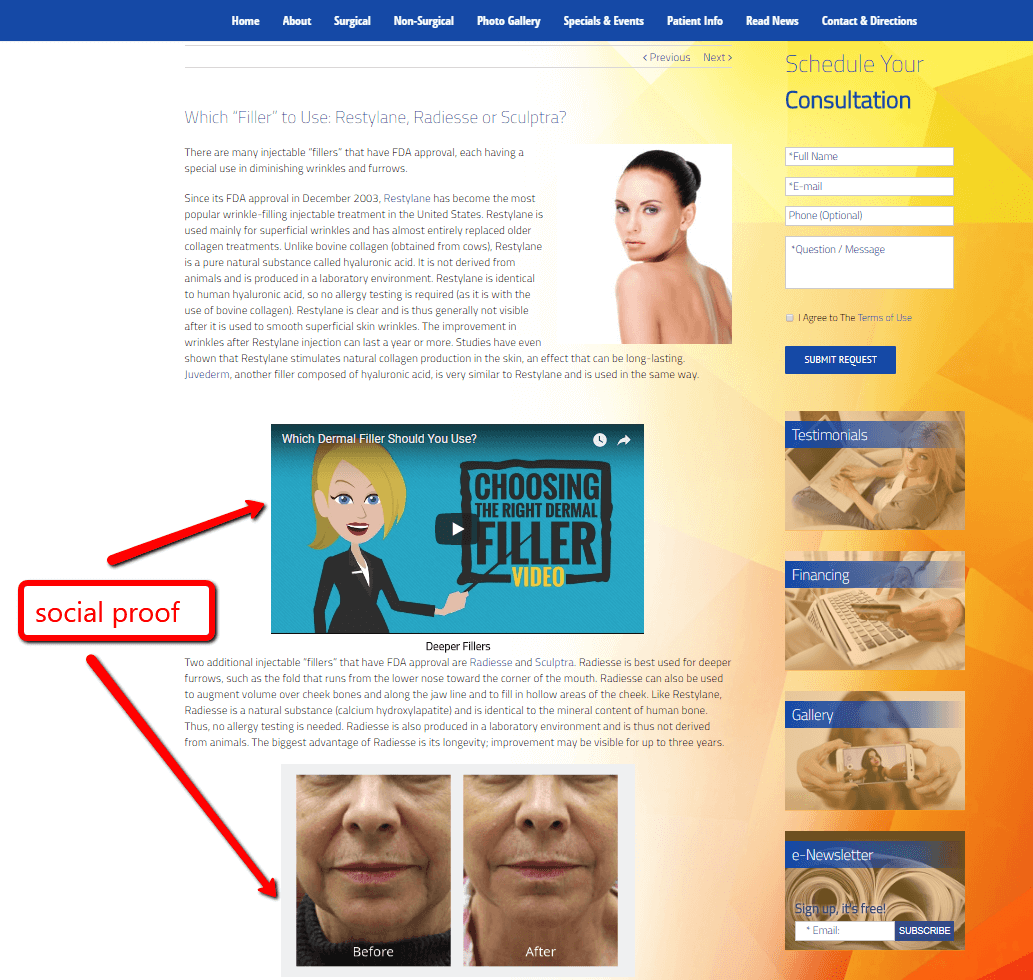
c) Does this page show social proof, such as before & afters or reviews?
d) Does this page have a call to action?
Make notes on pages that could be improved based on the aforementioned criteria. Now jump to All Pages. You’ll see a slight difference between Landing Pages and All Pages.
Landing Pages indicates where visitors are entering the website, while All Pages highlights where they’re navigating to. You’ll likely see your photo gallery, Specials page, and Finance page showing up highly on the All Pages breakdown, but not on Landing Pages. This is because prospects and patients are interested in knowing what a procedure costs and how they can save money on it. You menu can dramatically influence which pages users navigate to, so make sure it is well-organized, and make sure you should prominently link to your gallery, Specials, and Financing Pages.
Dig deeper in Total Pages and see if any pages stand out, and then run through the checklist above, just like you did with Landing Pages.
Lastly, check out your Exit Pages. These are your top pages where visitors are leaving the website. Like Landing Pages and Total Pages, you want to spot issues our concerns that would cause a visitor to leave.
*Important note: some Google Analytics info can be misleading. Make sure you thoroughly evaluate each page and don’t jump to conclusions based on a single metric.
3) Know how to create a game-plan based on the opportunities you’ve discovered
Not that you’ve got a list, and you’ve narrowed it down by noting opportunities to improve these pages, it’s time to take action. Re-write the copy, add a before & after case, add a video, add a review, promote a special around this procedure, or work in a stock image. Once you’ve updated these pages then make a note to check back in a week and in a month to see if you’re generating any more leads.
If you’d like to learn more about using Google Analytics tips and best practices check out our Google Analytics blog category. You can also certified in Google Analytics, which you can learn more about here. If you’d like to learn more about our marketing packages then give us a call at 877-673-7096 x2 or shoot us a note here.